Real Estate Market Trends in the Montclair Denver Neighborhood
Check in with Elevation Realty for the latest market trends in the Montclair area.
Montclair 2016 Q4 Market Trends in Denver
March 15, 2017

Residing on the South side of Colfax and East of the Hale neighborhood, Montclair is another Denver hot-spot for real estate. With the average home price increasing more than $350,000 in 10 years, sellers in this neighborhood have greatly profited from the sale of their home. In Q4 there were 15 active listings, seven under contract listings, 33 listings sold, and the average sold price of a home was $576,205.Â
More interestingly is the average price of active listings in Montclair was $797,113, more than $200,000 off from the average sold price of a home in the area. Seemingly, there are many different sizes and qualities of homes in this area. If you're looking for something in your budget, Montclair has a range of options.Â
Contact Elevation Realty to help you in your Denver housing search. Dave knows all the best neighborhoods and areas and can help you find the home of your dreams.Â
Read More...
More interestingly is the average price of active listings in Montclair was $797,113, more than $200,000 off from the average sold price of a home in the area. Seemingly, there are many different sizes and qualities of homes in this area. If you're looking for something in your budget, Montclair has a range of options.Â
Contact Elevation Realty to help you in your Denver housing search. Dave knows all the best neighborhoods and areas and can help you find the home of your dreams.Â
Montclair Q1 Market Trends
April 25, 2016

In Q1 of 2016 for home sales in the Denver neighborhood Montclair, there were 34 total sold listings. The average price of these sold homes was $508,260, a $58,627 increase from Q4 in 2015. The average asking price was $513,175 of sold listings, down from last quarter's $579,763, and with an average discount of -0.70%.Â
Montclair had 12 active listings, as it did in Q4 of 2015. The average price of these active listings is $892,895. Just as with the last quarter, the average time the listings were on the market was 40 days. In addition to the 12 active listings, there were 22 listings under contract in Montclair.
Learn more about the Montclair neighborhood in Denver and what it has to offer. Keep up to date with the latest news and market trends at Elevation Realty. We want our clients to be equipped with the best information and help them make informed decisions in the home buying or selling process.Â
Read More...
Montclair had 12 active listings, as it did in Q4 of 2015. The average price of these active listings is $892,895. Just as with the last quarter, the average time the listings were on the market was 40 days. In addition to the 12 active listings, there were 22 listings under contract in Montclair.
Learn more about the Montclair neighborhood in Denver and what it has to offer. Keep up to date with the latest news and market trends at Elevation Realty. We want our clients to be equipped with the best information and help them make informed decisions in the home buying or selling process.Â
Montclair Q4 Market Trends
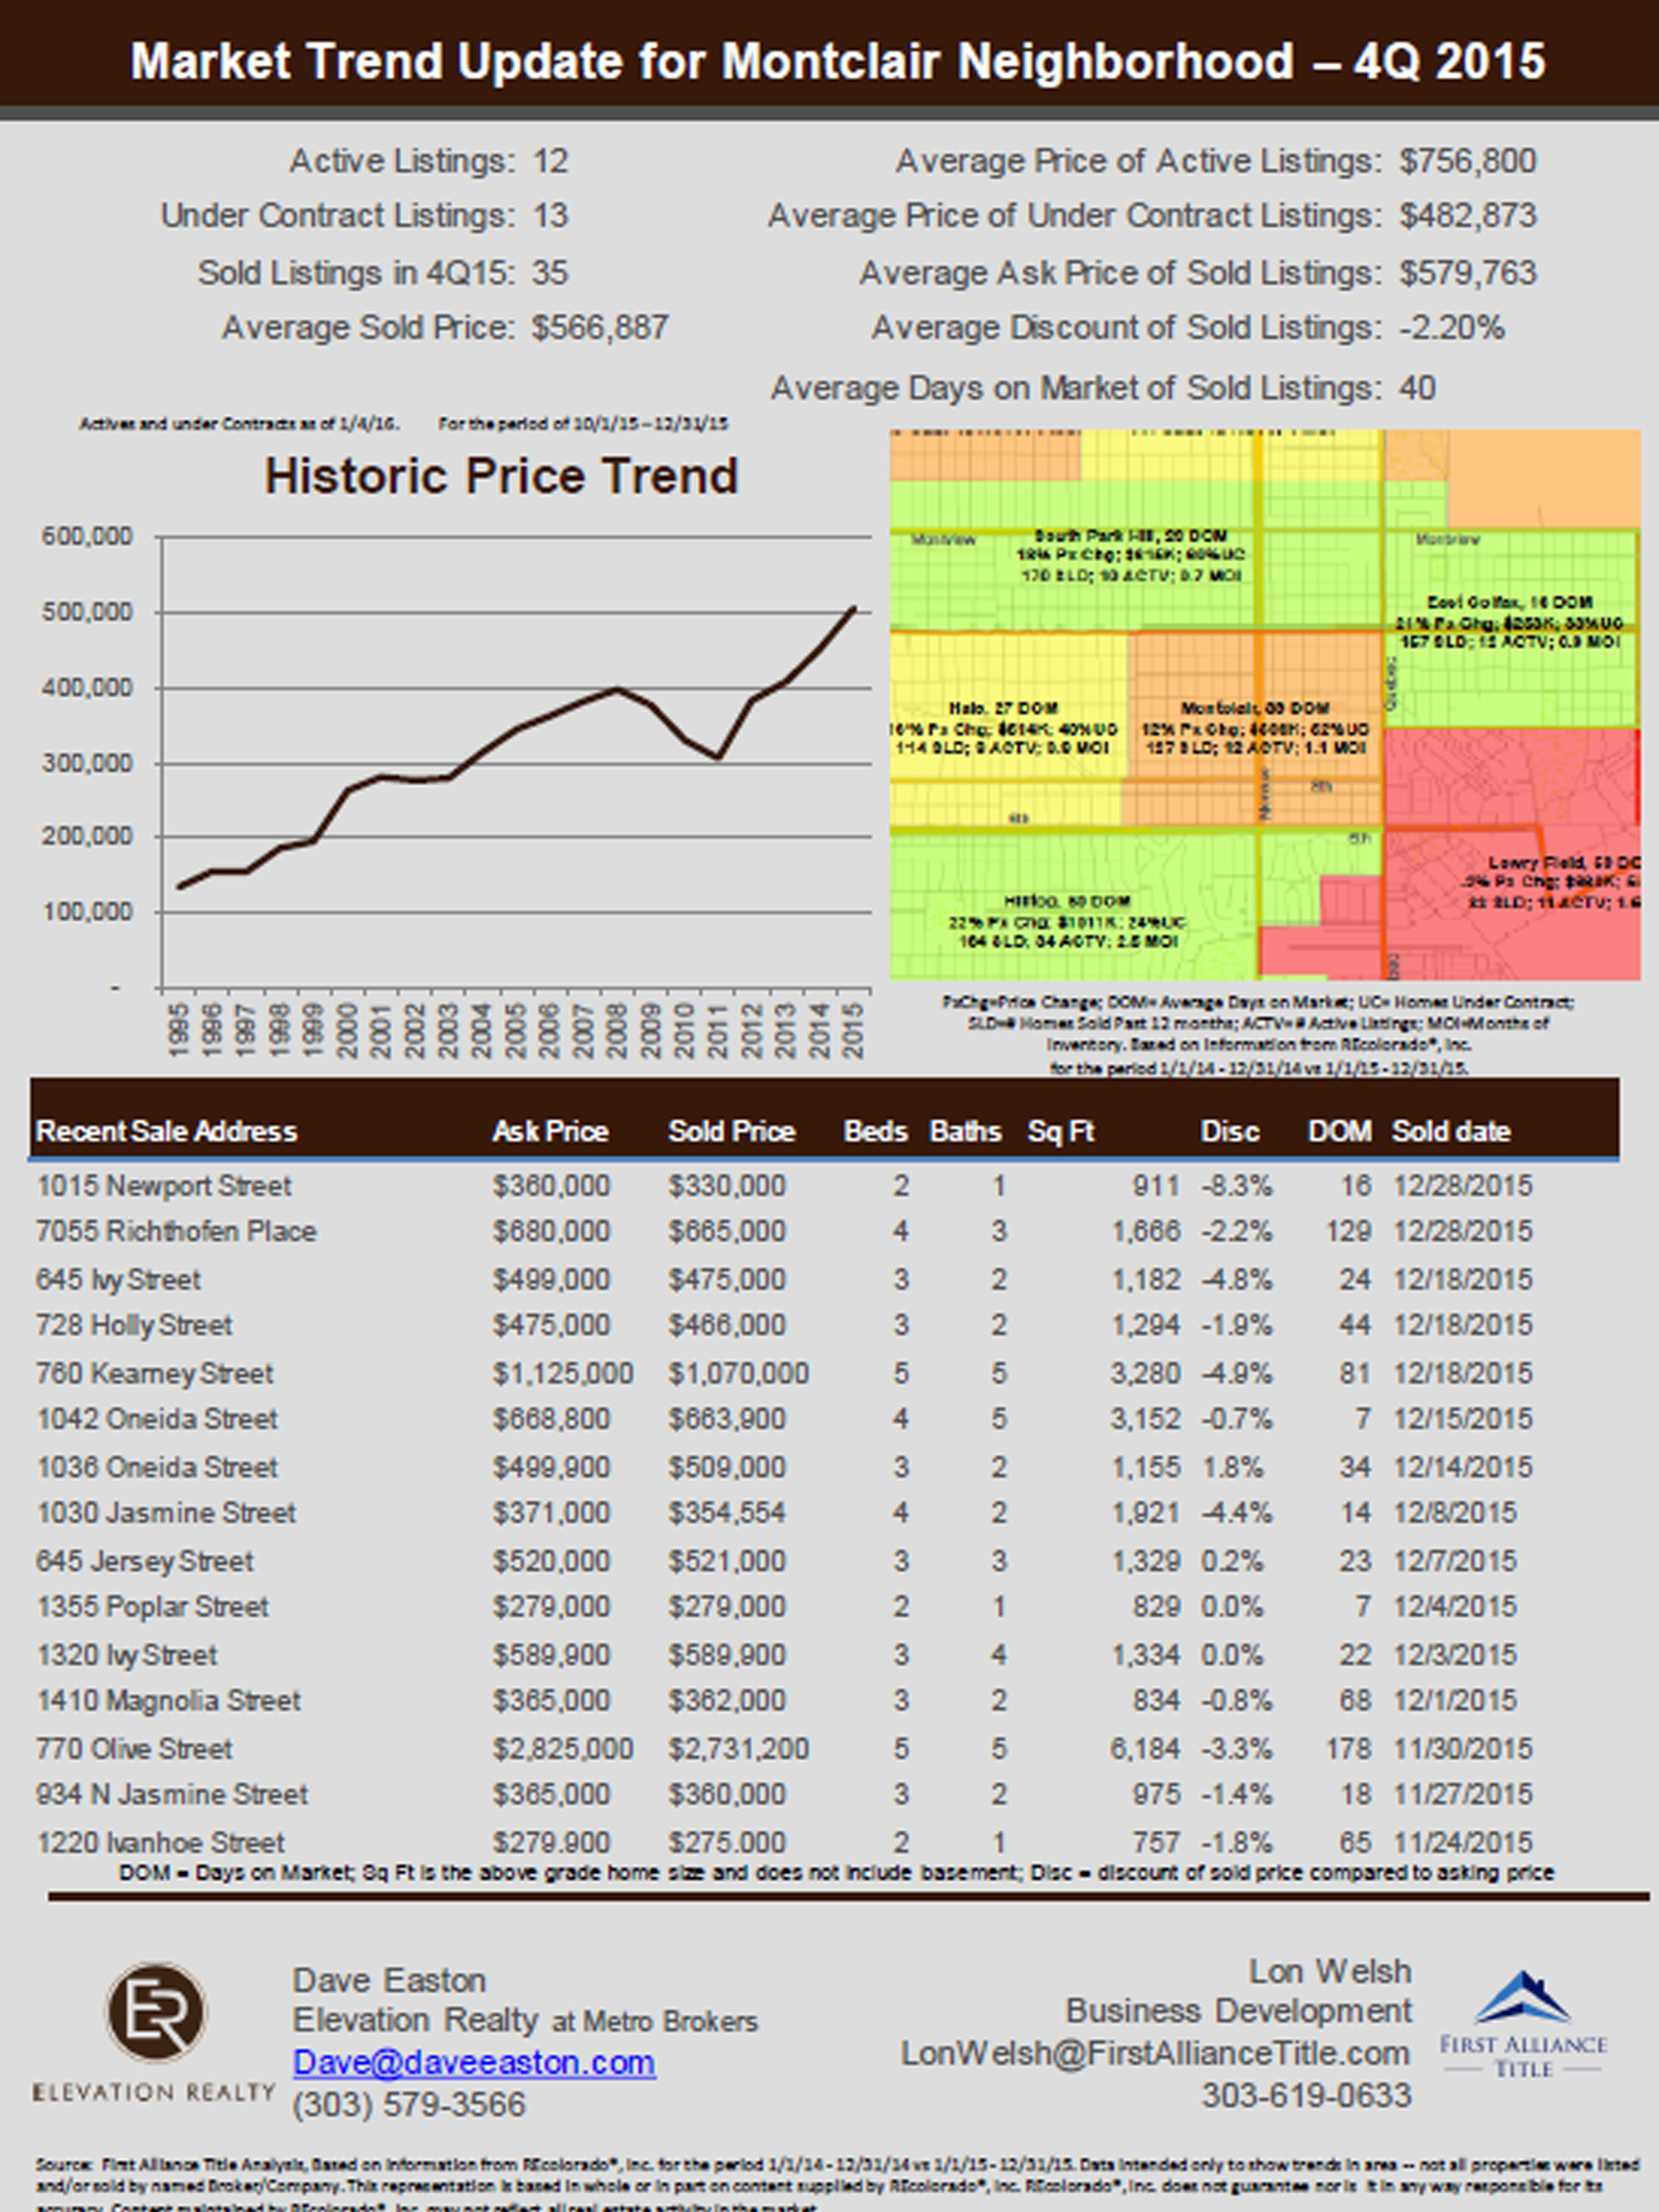
In Q4 for home sales in the Denver neighborhood Montclair, there were 35 total sold listings up from 28 in Q3. Â The average price of these sold homes was $566,887, a $107,365 increase from Q3. Â Although the average sale price went up, more than half the properties sold for less than asking price.
Montclair had 12 active listings compared with more than twice that in Q3. The average price of these active listings are $756,800. Compared to the last quarter, the average time the listings were on the market was a long 40 days. In addition to the 12 active listings, there were 13 listings under contract in Montclair.
Learn more about the Montclair neighborhood in Denver and what it has to offer. Keep up to date with the latest news and market trends at Elevation Realty. We want our clients to be equipped with the best information and help them make informed decisions in the home buying or selling process.Â
Â
Read More...
Montclair had 12 active listings compared with more than twice that in Q3. The average price of these active listings are $756,800. Compared to the last quarter, the average time the listings were on the market was a long 40 days. In addition to the 12 active listings, there were 13 listings under contract in Montclair.
Learn more about the Montclair neighborhood in Denver and what it has to offer. Keep up to date with the latest news and market trends at Elevation Realty. We want our clients to be equipped with the best information and help them make informed decisions in the home buying or selling process.Â
Â
Q3 Montclair Neighborhood Market Trends
November 2, 2015

In Q3 for home sales in the Denver neighborhood Montclair, there were 28 total sold listings with an average price of $459,522. This number is fairly consistent as compared to the previous quarter at $471,275. In Q2, the difference between the actual average sold price and the actual asking price did not differ greatly, however this quarter saw a larger gap of approximately 8K with the asking price on the higher end.
Montclair had 27 active listings at the close of Q3 with an average price of $733,156. Compared to the market trends of the Hale neighborhood, the number of days on the market was lower by 6 days – only 16 days on average. In addition to the 27 active listings, there were 17 listings under contract in Montclair.
Learn more about the Montclair neighborhood in Denver and what it has to offer. Keep up to date with the latest news and market trends at Elevation Realty. We want our clients to be equipped with the best information and help them make informed decisions in the home buying or selling process.Â
Read More...
Montclair had 27 active listings at the close of Q3 with an average price of $733,156. Compared to the market trends of the Hale neighborhood, the number of days on the market was lower by 6 days – only 16 days on average. In addition to the 27 active listings, there were 17 listings under contract in Montclair.
Learn more about the Montclair neighborhood in Denver and what it has to offer. Keep up to date with the latest news and market trends at Elevation Realty. We want our clients to be equipped with the best information and help them make informed decisions in the home buying or selling process.Â
Market Trend Update for Montclair Neighborhood
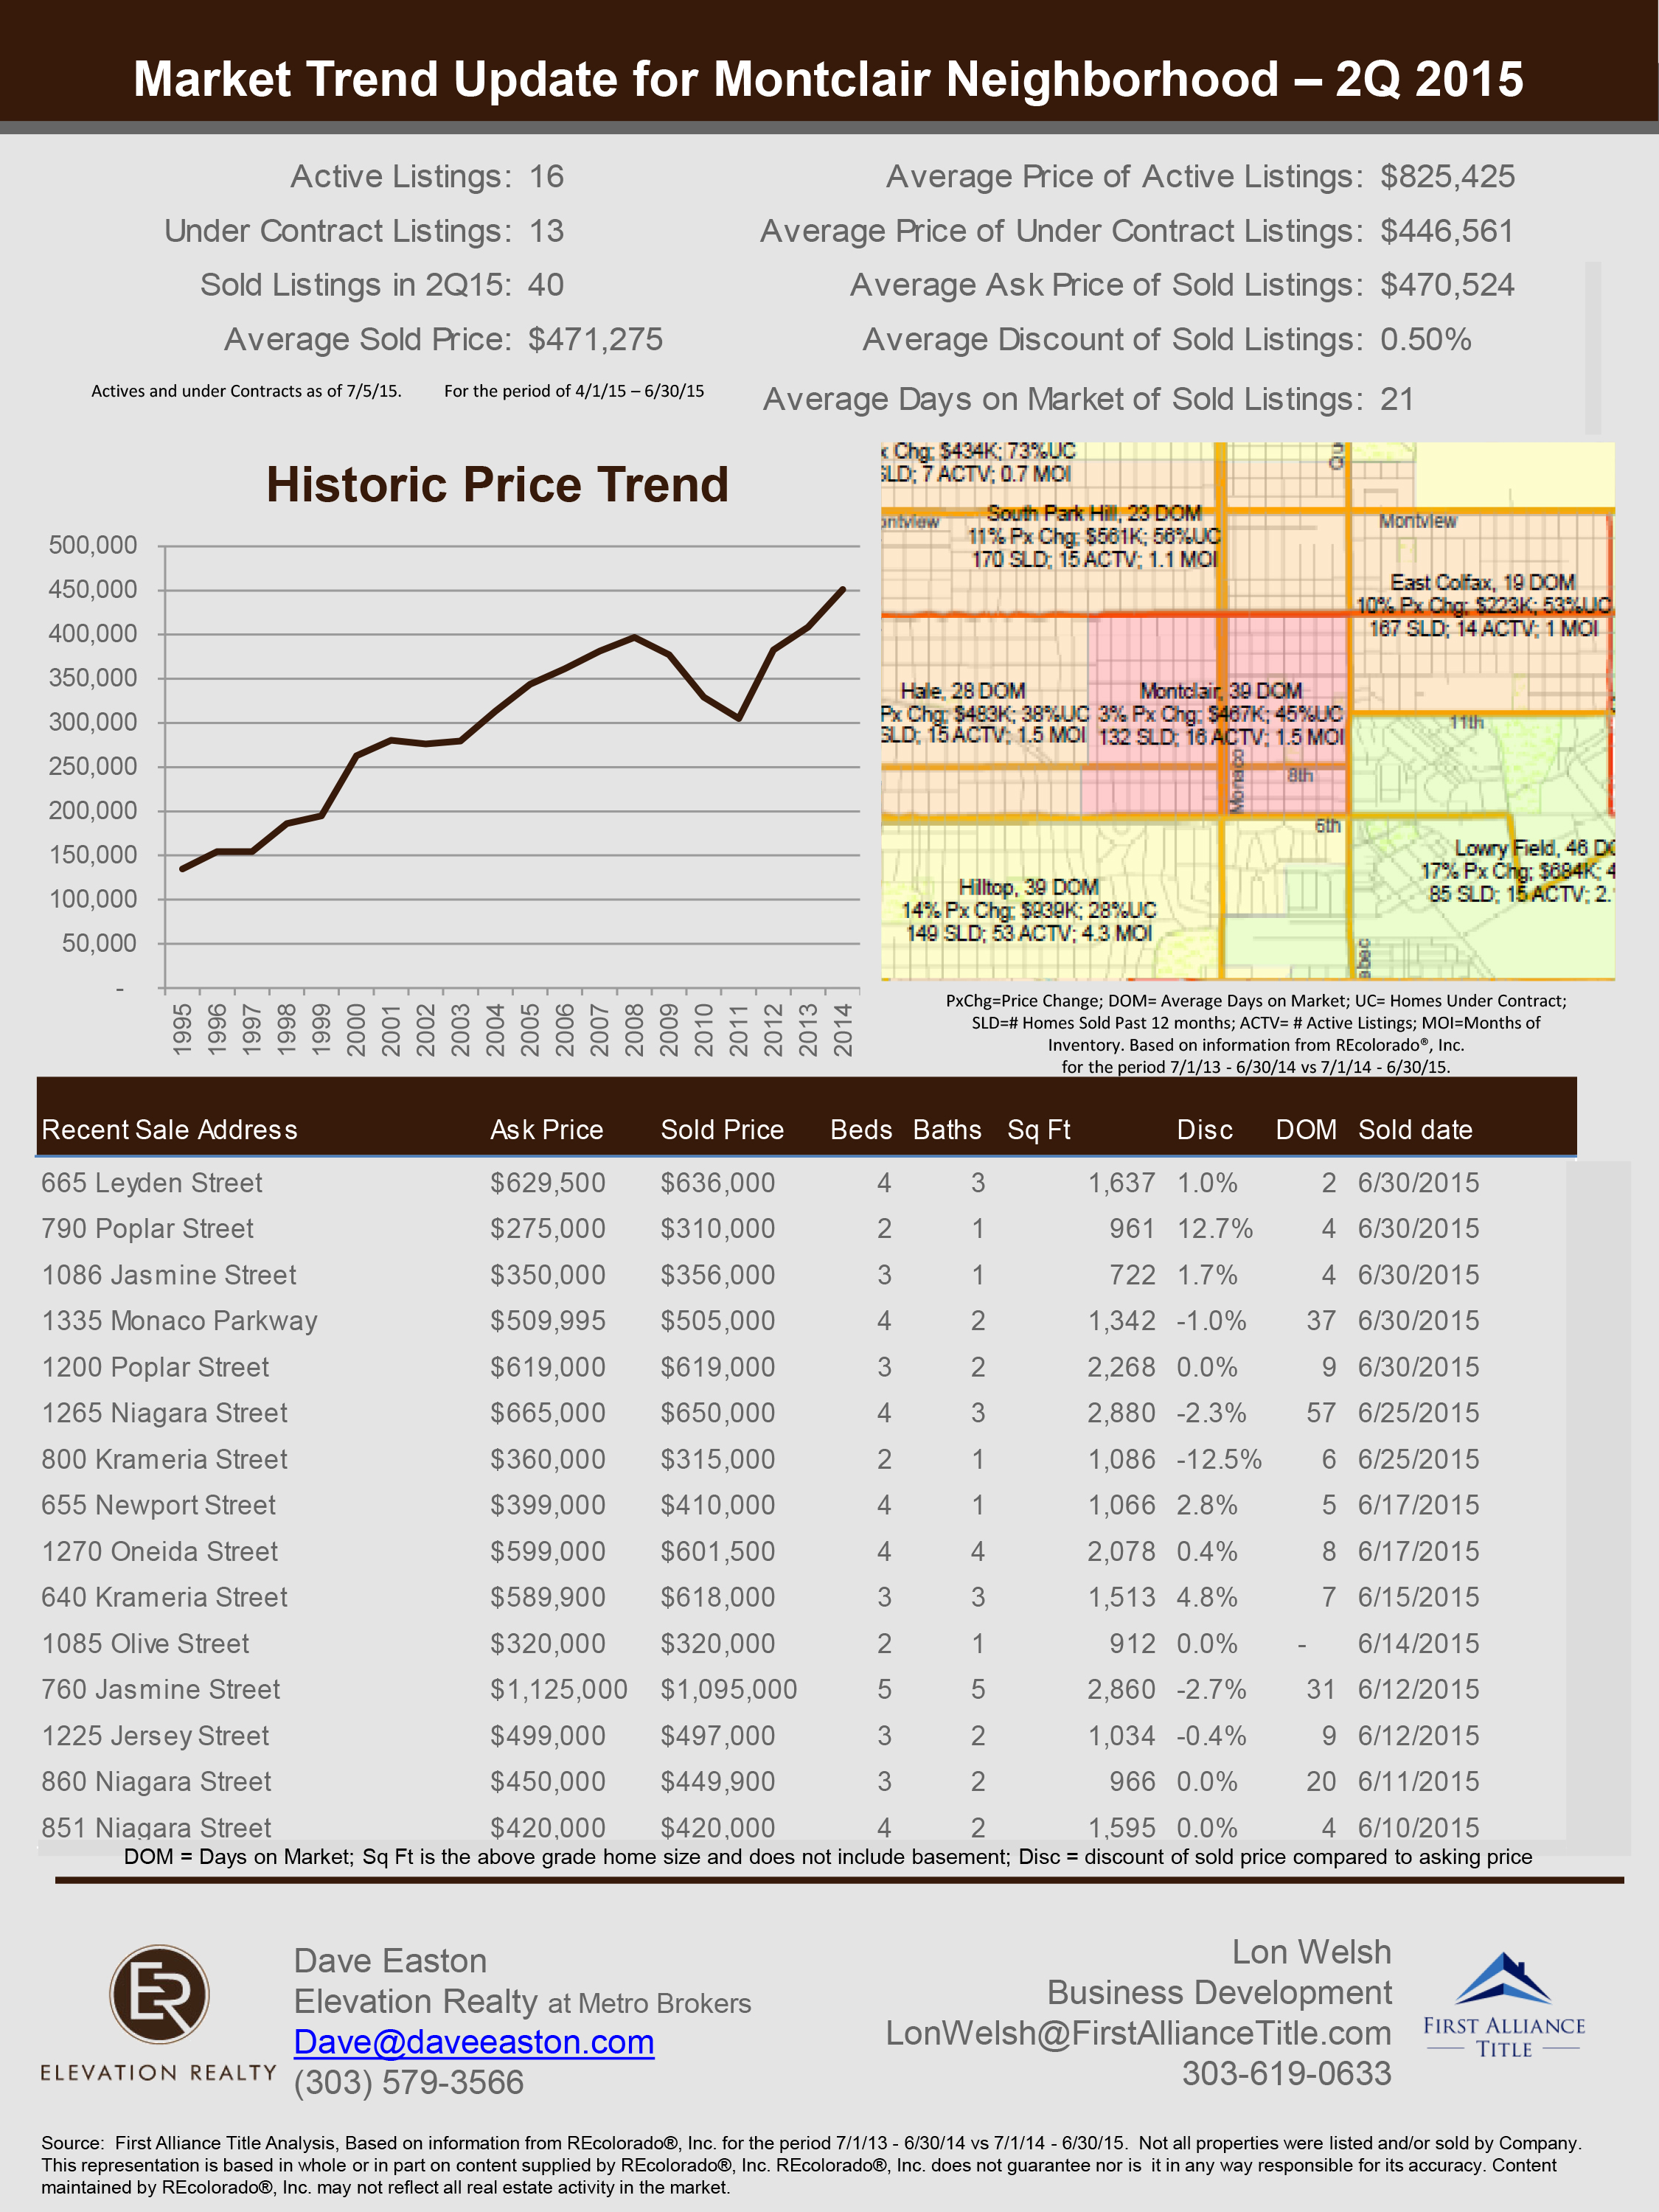
This quarter, the Montclair neighborhood is currently showcasing 16 active listings with the average price of $825,425. Listings under contract had an average of $446,561 for the 13 recorded. 83 homes were sold with the average sold price of $471,275 and the average time on the market for sold listings was 21 days.
While the average asking price for Montclair homes for sale was $470,524, the average discount recorded of sold listings was 0.50%. In 2014 the price trend for homes averaged about $450,000 and past years degraded from that amount down to $300,000 in 2011. The price of homes in this area is still on the rise - contact the experts at Elevation Realty to learn more about the homes for sale in Montclair.
While the average asking price for Montclair homes for sale was $470,524, the average discount recorded of sold listings was 0.50%. In 2014 the price trend for homes averaged about $450,000 and past years degraded from that amount down to $300,000 in 2011. The price of homes in this area is still on the rise - contact the experts at Elevation Realty to learn more about the homes for sale in Montclair.